Introducing the New Twilee Dashboard
We're excited to announce a completely redesigned dashboard that gives you instant insights into your QR code performance and account activity.
The new dashboard transforms how you monitor and understand your QR codes, providing real-time analytics and actionable data at a glance. Whether you're managing a handful of codes or hundreds, the dashboard keeps you informed and in control.
What's New in the Dashboard
Real-Time Scan Analytics
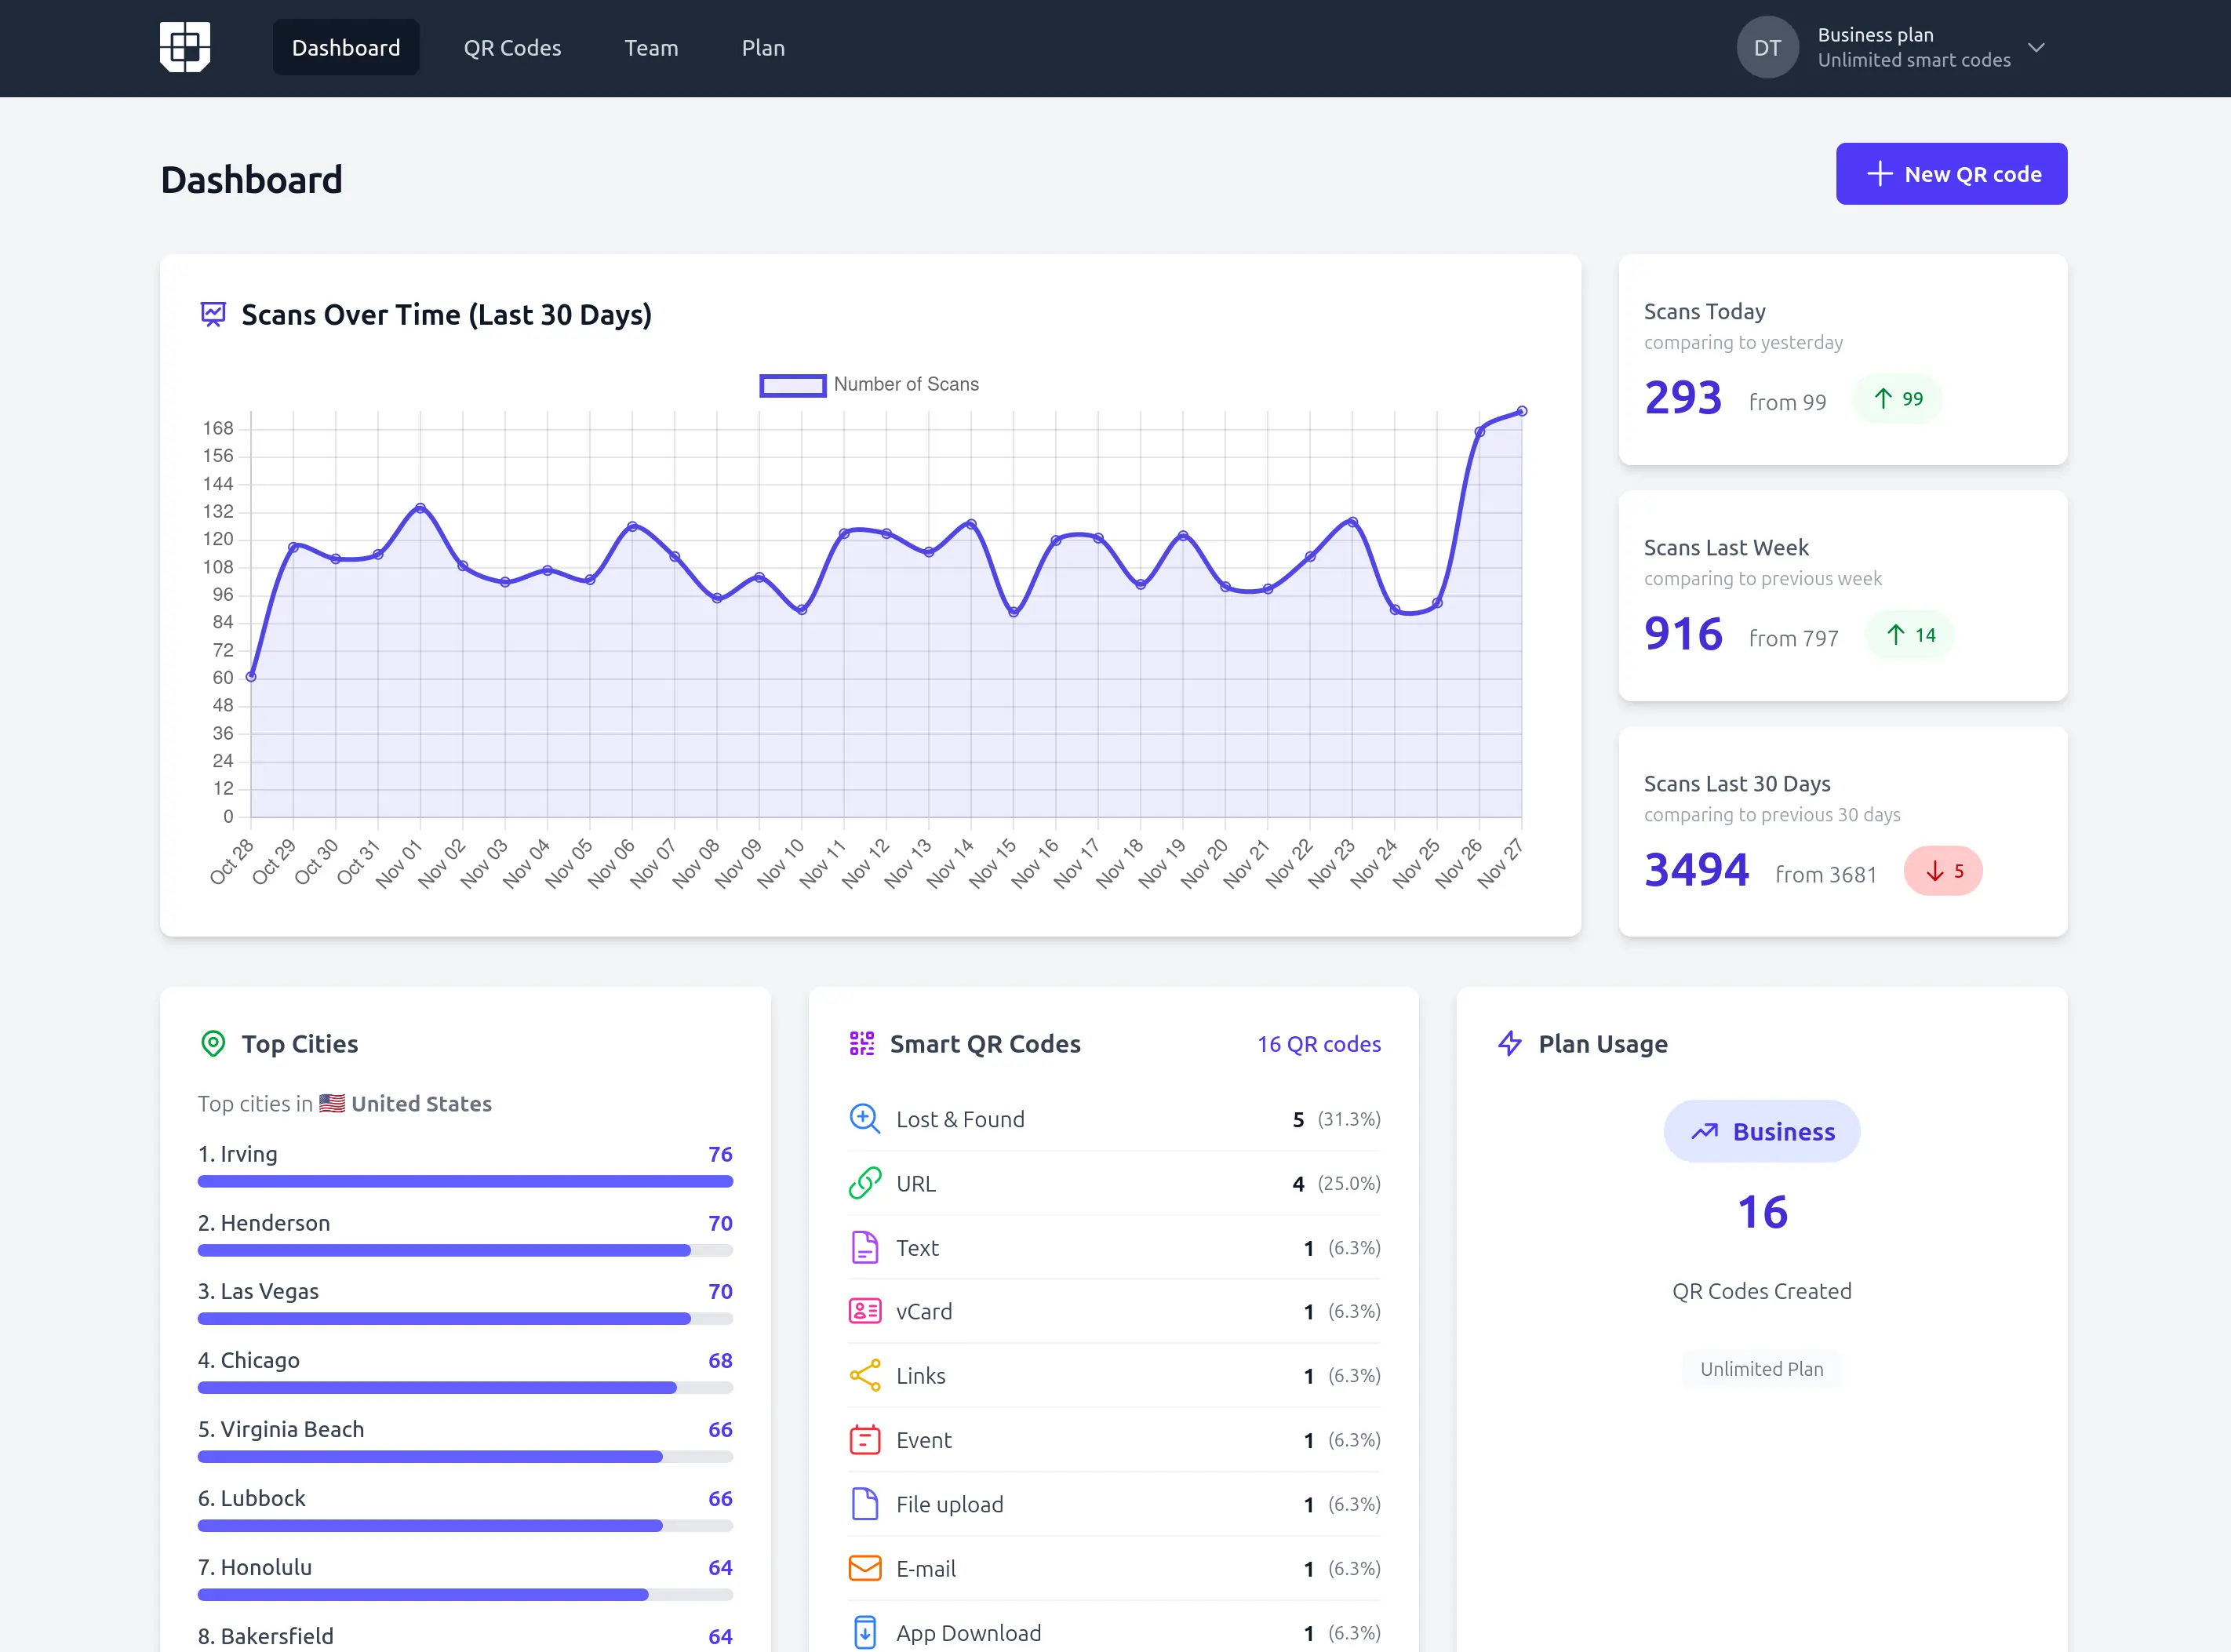
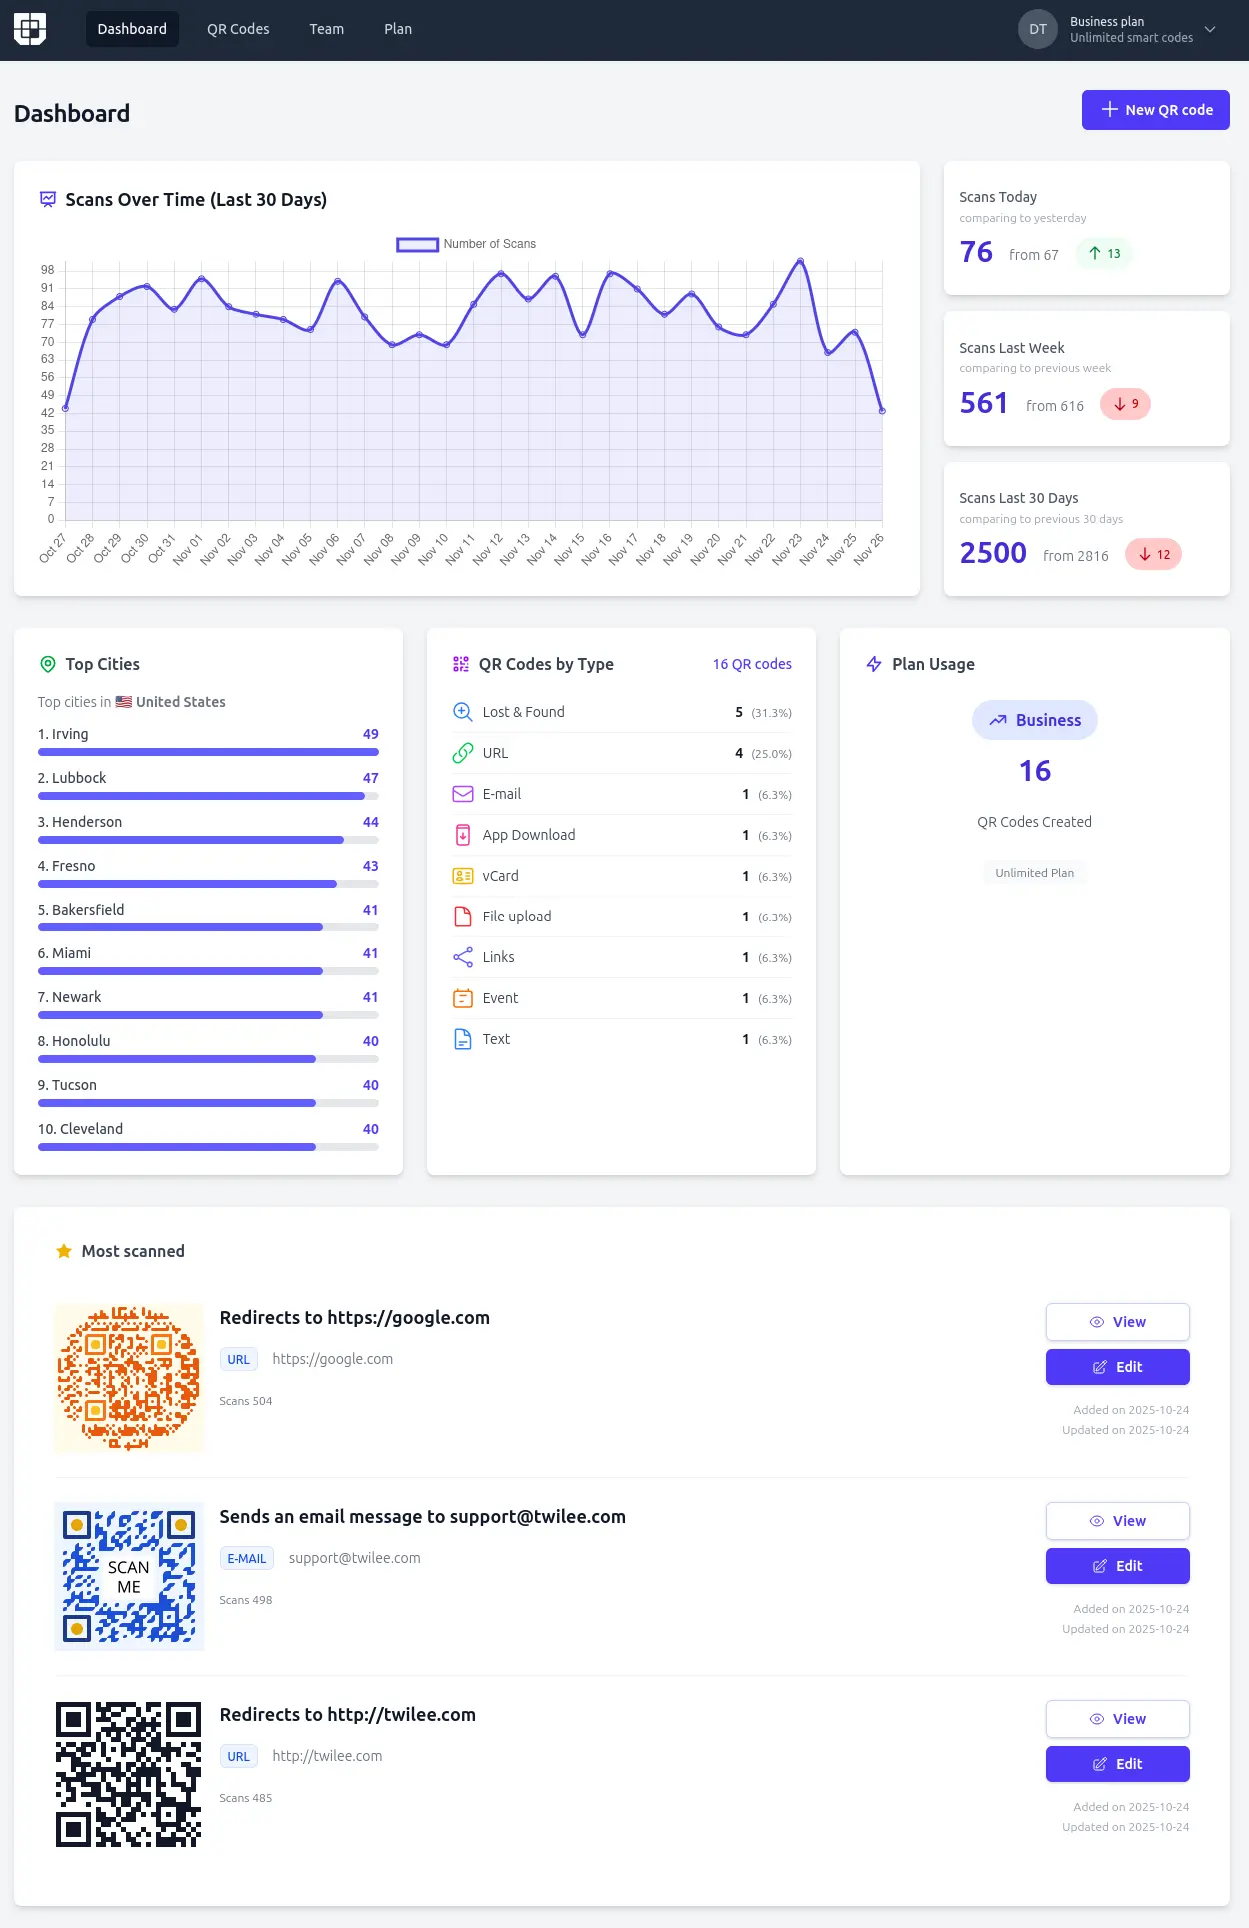
Your QR code performance is now front and center with comprehensive scan metrics:
Today's Activity
- See how many scans you've received today
- Compare with previous days to spot trends
- Understand daily engagement patterns
- Track real-time performance
Last 7 Days Overview
- Weekly scan totals at a glance
- Comparison with the previous week
- Identify weekly trends and patterns
- See if your campaigns are gaining momentum
Last 30 Days Summary
- Monthly scan performance
- Month-over-month comparison
- Track long-term engagement growth
- Understand seasonal patterns
These comparative metrics help you understand not just the numbers, but the trends — are your scans increasing? Is today busier than usual? How does this week compare to last week? The dashboard answers these questions instantly.
Geographic Insights (Premium Feature)
For Premium plan users, the dashboard now displays your top scanning cities, giving you valuable geographic insights into where your audience is located:
- Identify which cities generate the most engagement
- Understand your geographic reach
- Make informed decisions about regional campaigns
- Discover unexpected markets and opportunities
This location data helps you tailor content, plan events, and understand where your QR codes are making the biggest impact.
QR Code Portfolio Overview
Get a complete snapshot of your QR code collection:
QR Code Count by Type
- See how many QR codes you've created
- View breakdown by type (Event, Audio, Text, Lost & Found, Links)
- Understand which content types you use most
- Identify opportunities for new QR code types
This overview helps you manage your growing QR code portfolio and ensures you're leveraging all of Twilee's capabilities.
Plan & Usage Monitoring
Stay informed about your account status:
Current Plan Details
- View your active subscription plan
- See plan features and benefits
- Monitor days until renewal
- Quick access to upgrade options
Usage Tracking
- Monitor your scan quota usage
- See remaining scans for the billing period
- Understand when you might need to upgrade
- Track growth over time
No surprises. No hidden limits. Just clear, transparent information about your account.
Top Performing QR Codes
Discover which QR codes are driving the most engagement:
Top 3 Most Scanned QR Codes
- See your highest-performing codes at a glance
- Quick access to edit or view each code
- Understand what content resonates most
- Identify successful campaigns worth replicating
This feature helps you double down on what works and optimize underperforming codes.
Why the Dashboard Matters
Before the new dashboard, you had to dig through individual QR codes to understand performance. Now, everything important is visible the moment you log in:
Immediate Insights
- No clicking through multiple pages
- All key metrics in one view
- Understand your performance in seconds
- Make data-driven decisions quickly
Trend Identification
- Comparative metrics reveal patterns
- Spot growth opportunities early
- Identify issues before they become problems
- Track campaign effectiveness over time
Simplified Management
- Monitor multiple QR codes effortlessly
- Prioritize attention on top performers
- Stay within plan limits confidently
- Scale your usage strategically
A Dashboard That Evolves
This is just the beginning. We're continuously improving the dashboard based on user feedback and needs. Here's what we're working on:
Coming Soon
- Customizable date ranges for analytics
- Exportable reports and data
- Device type breakdown (mobile, tablet, desktop)
- Hour-by-hour scan patterns
- Individual QR code performance graphs
- Custom dashboard widgets
- Team collaboration features
- Advanced filtering and sorting
The dashboard is a living feature that will grow alongside your needs. As Twilee evolves, so does your control center.
Access for Everyone
The core dashboard features are available on all Twilee plans:
Free Plan
- Last 30 days scan overview
- QR code count and types
- Plan and usage monitoring
- Top 3 performing codes
Premium Plans
- All free features, plus
- Top cities geographic insights
- Extended analytics history
- Priority support
No matter your plan, you get visibility into your QR code performance.
How to Access Your Dashboard
Your new dashboard is already live:
- Log in to Twilee at twilee.com/login
- View your dashboard — it's the first thing you see
- Explore the metrics — hover over elements for additional details
- Click through to individual QR codes for deeper insights
It's that simple.
Built on Your Feedback
This dashboard redesign reflects months of user feedback and requests. You asked for:
✅ Quick performance overview — We delivered
✅ Comparative metrics — We delivered
✅ Geographic insights — We delivered
✅ Portfolio management — We delivered
✅ Top performers visibility — We delivered
We're listening, building, and improving based on what you need. Keep the feedback coming — it shapes everything we create.
What This Means for Your Workflow
Before:
- Log in → Navigate to QR codes → Click individual codes → Check stats → Repeat
- Time-consuming and fragmented
- Hard to see the big picture
- Easy to miss important trends
After:
- Log in → See everything that matters instantly
- Comprehensive overview in seconds
- Identify trends and opportunities immediately
- Make informed decisions faster
The new dashboard doesn't just show data — it empowers decisions.
Real-World Impact
Early users of the new dashboard report:
- Faster campaign optimization — spotting trends in minutes instead of hours
- Better resource allocation — focusing on top-performing content types
- Informed scaling decisions — knowing when to upgrade based on actual usage
- Geographic strategy — targeting campaigns to high-engagement cities
- Content insights — understanding which QR code types drive results
Get Started Today
Experience the new dashboard yourself:
👉 Log in to Twilee and explore your new command center.
Already using Twilee? Your dashboard is already updated — just refresh and start exploring.
New to Twilee? Create a free account and see how the dashboard transforms QR code management.
We're Just Getting Started
The new dashboard is a major milestone, but it's not the destination — it's the foundation. We're committed to making Twilee the most powerful and intuitive QR code platform available.
Your feedback drives our roadmap. What would make the dashboard even more valuable for you? Let us know through the dashboard feedback button or contact our support team.
Ready to see your QR code performance like never before?
👉 Log in now and explore the new Twilee dashboard.
Data-driven decisions. Instant insights. Complete control.